Pre-loader
Solution

Tabulize (Visual-Insights)

Transforming Data Analysis & Reporting with Automation

Visual-Insights is an innovative tool revolutionizing the way data tabulation, PowerPoint reports, and dashboards are created. It’s designed to provide automated, interactive insights efficiently and accurately.

Challenges in Data Analysis and Reporting

In a fast-paced business environment, quick and informed decisions are vital. Real-time insights are key to staying competitive, but traditional data analysis methods can be time-consuming.

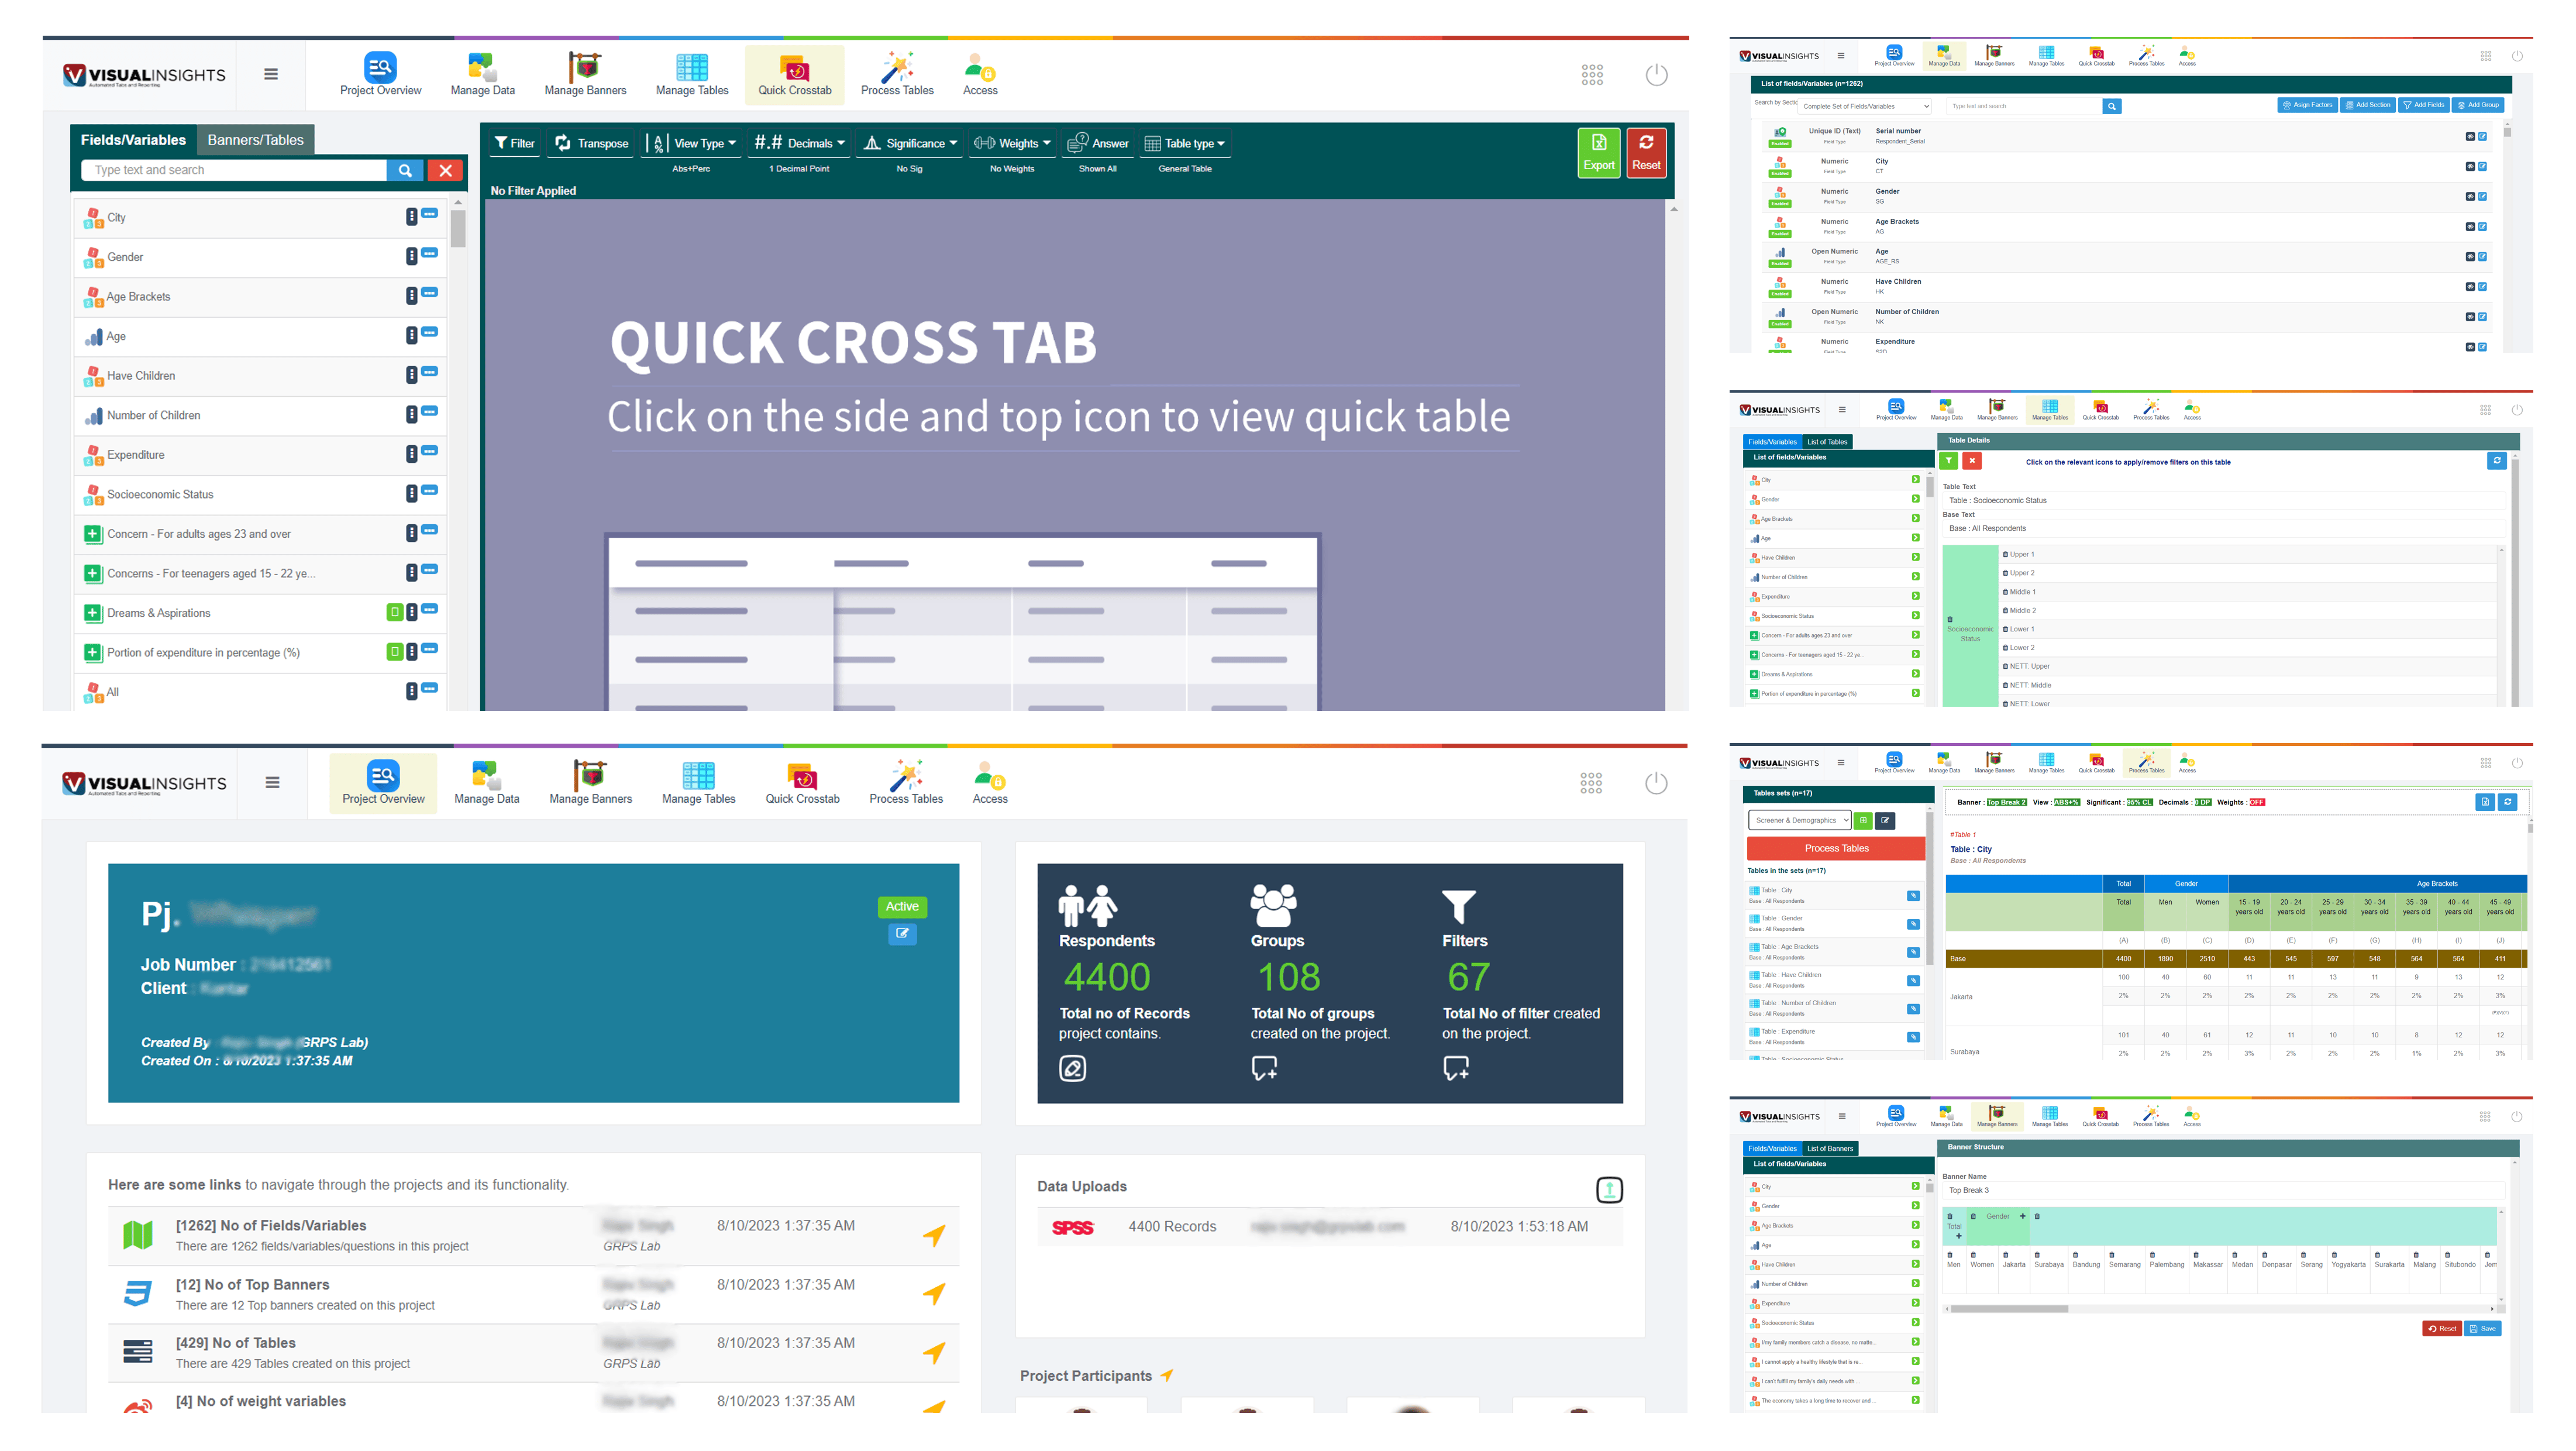
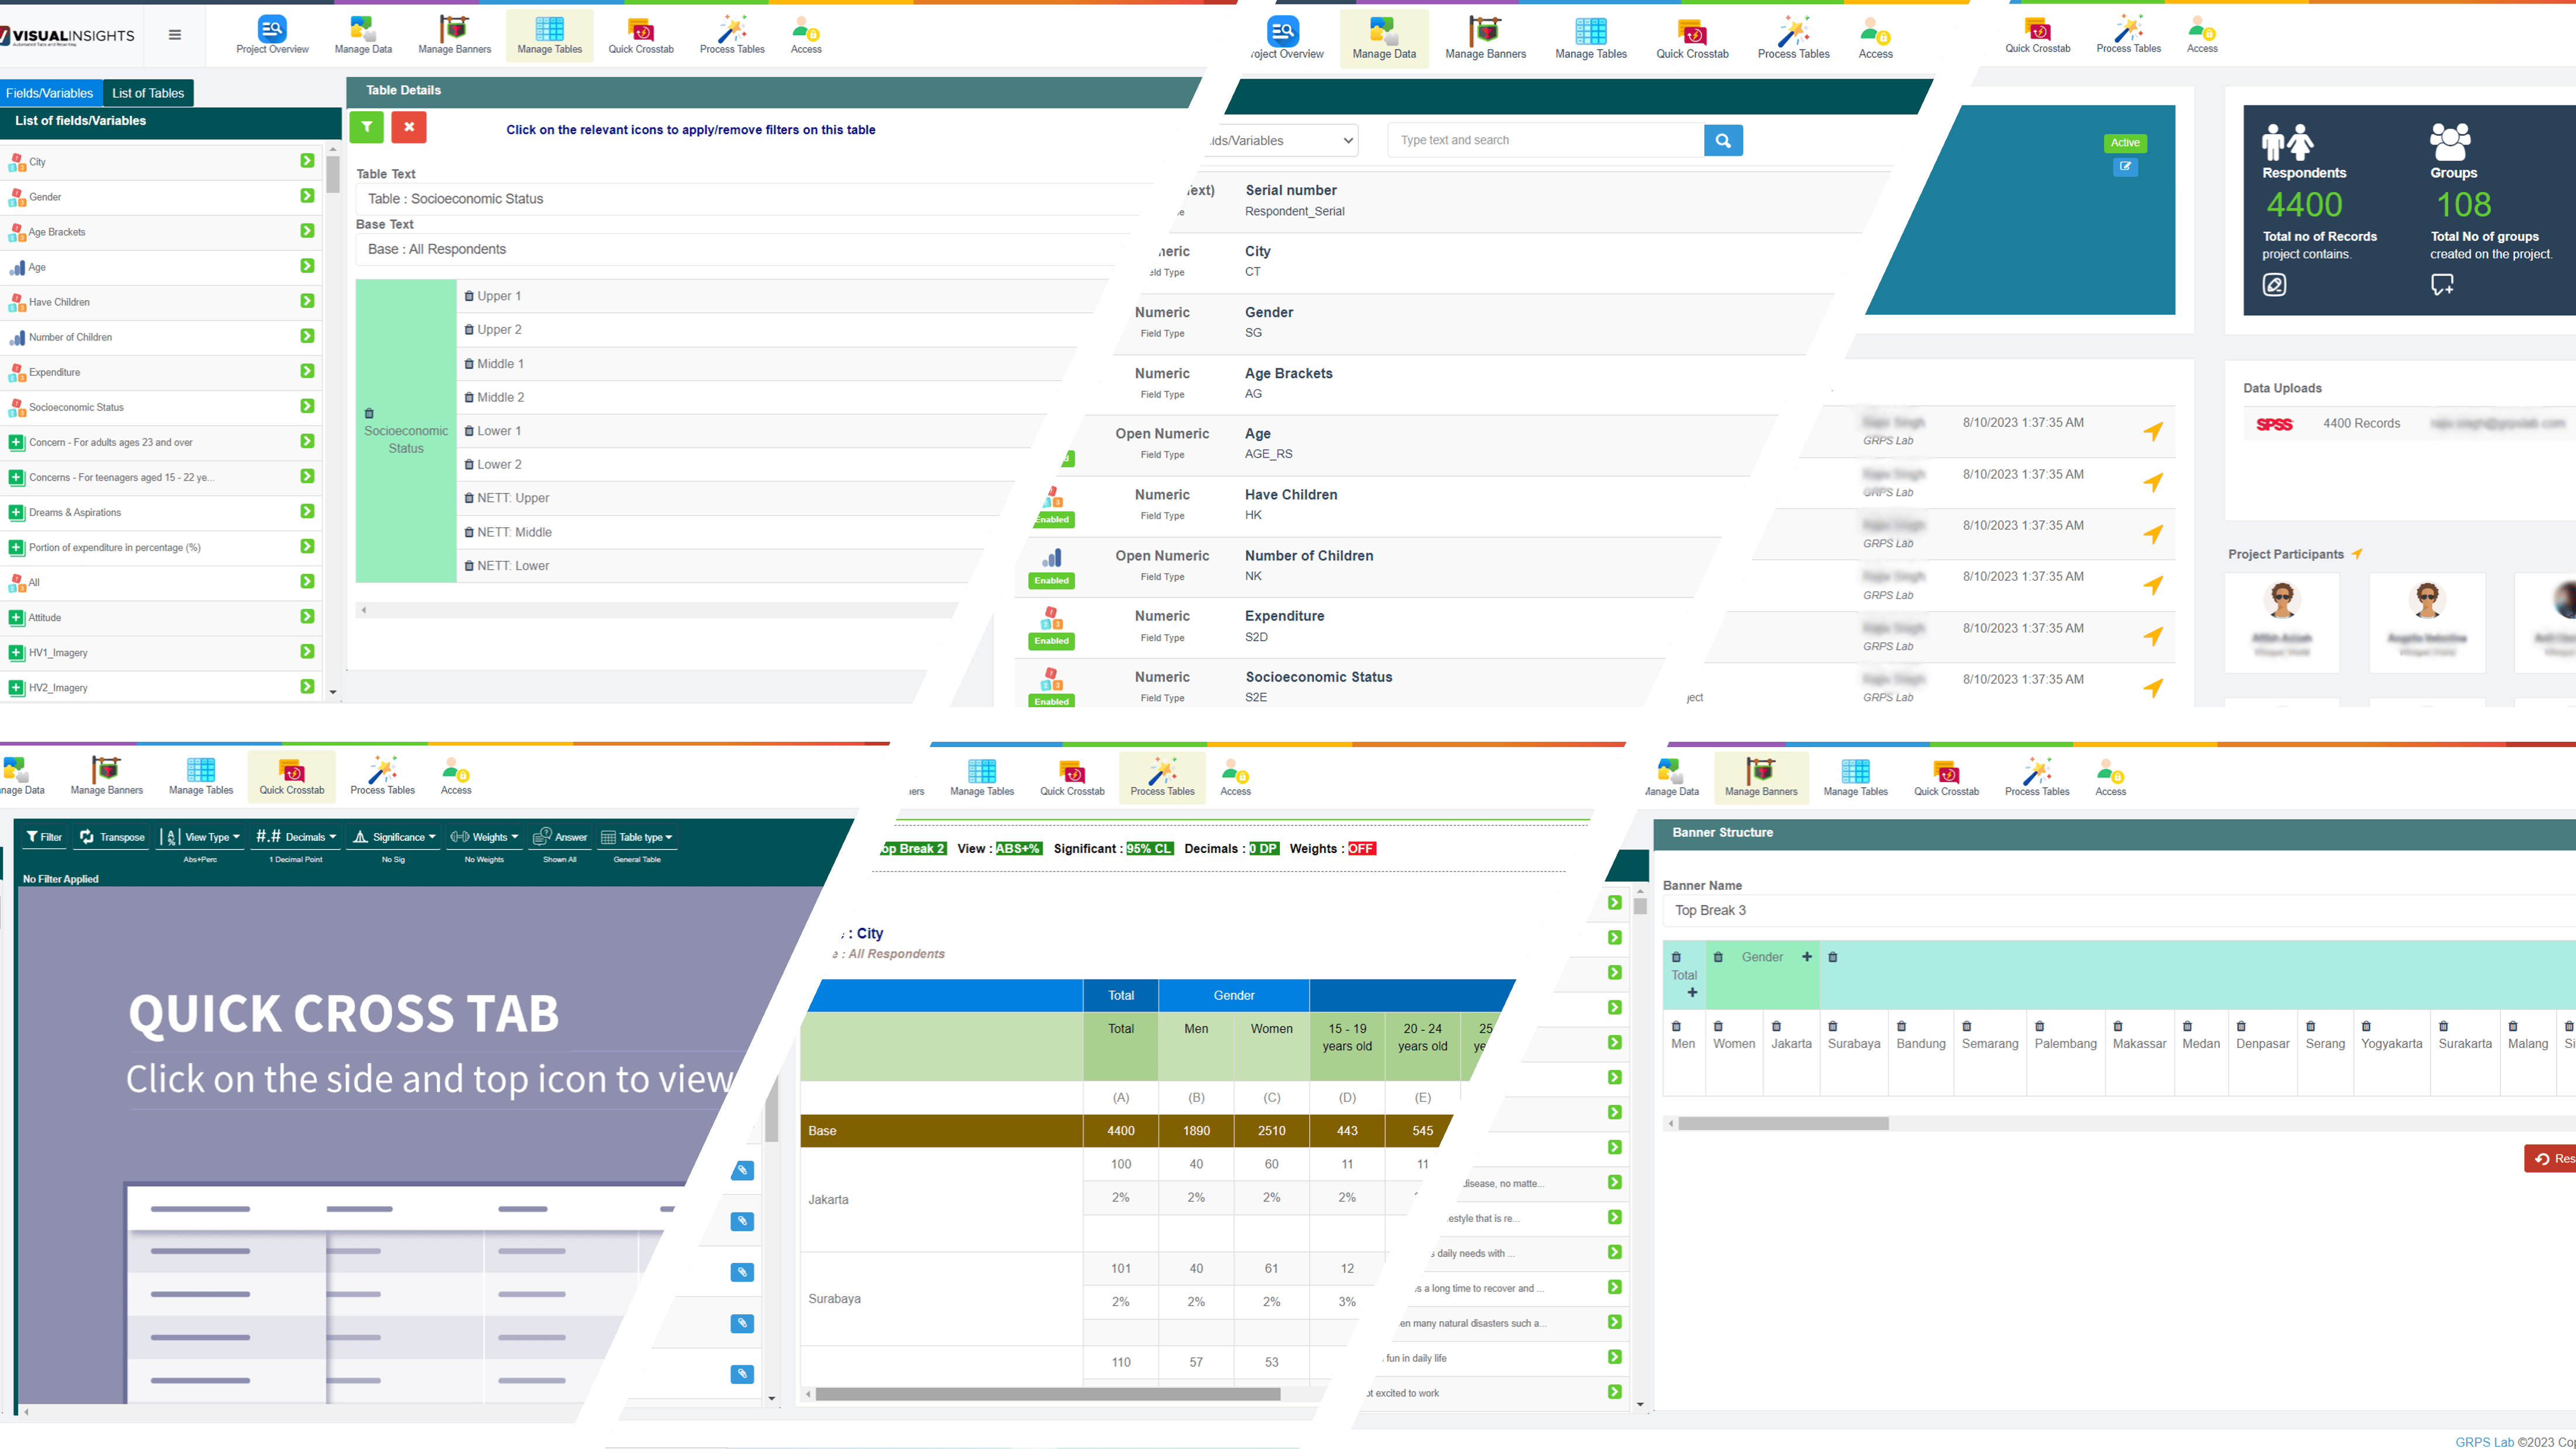
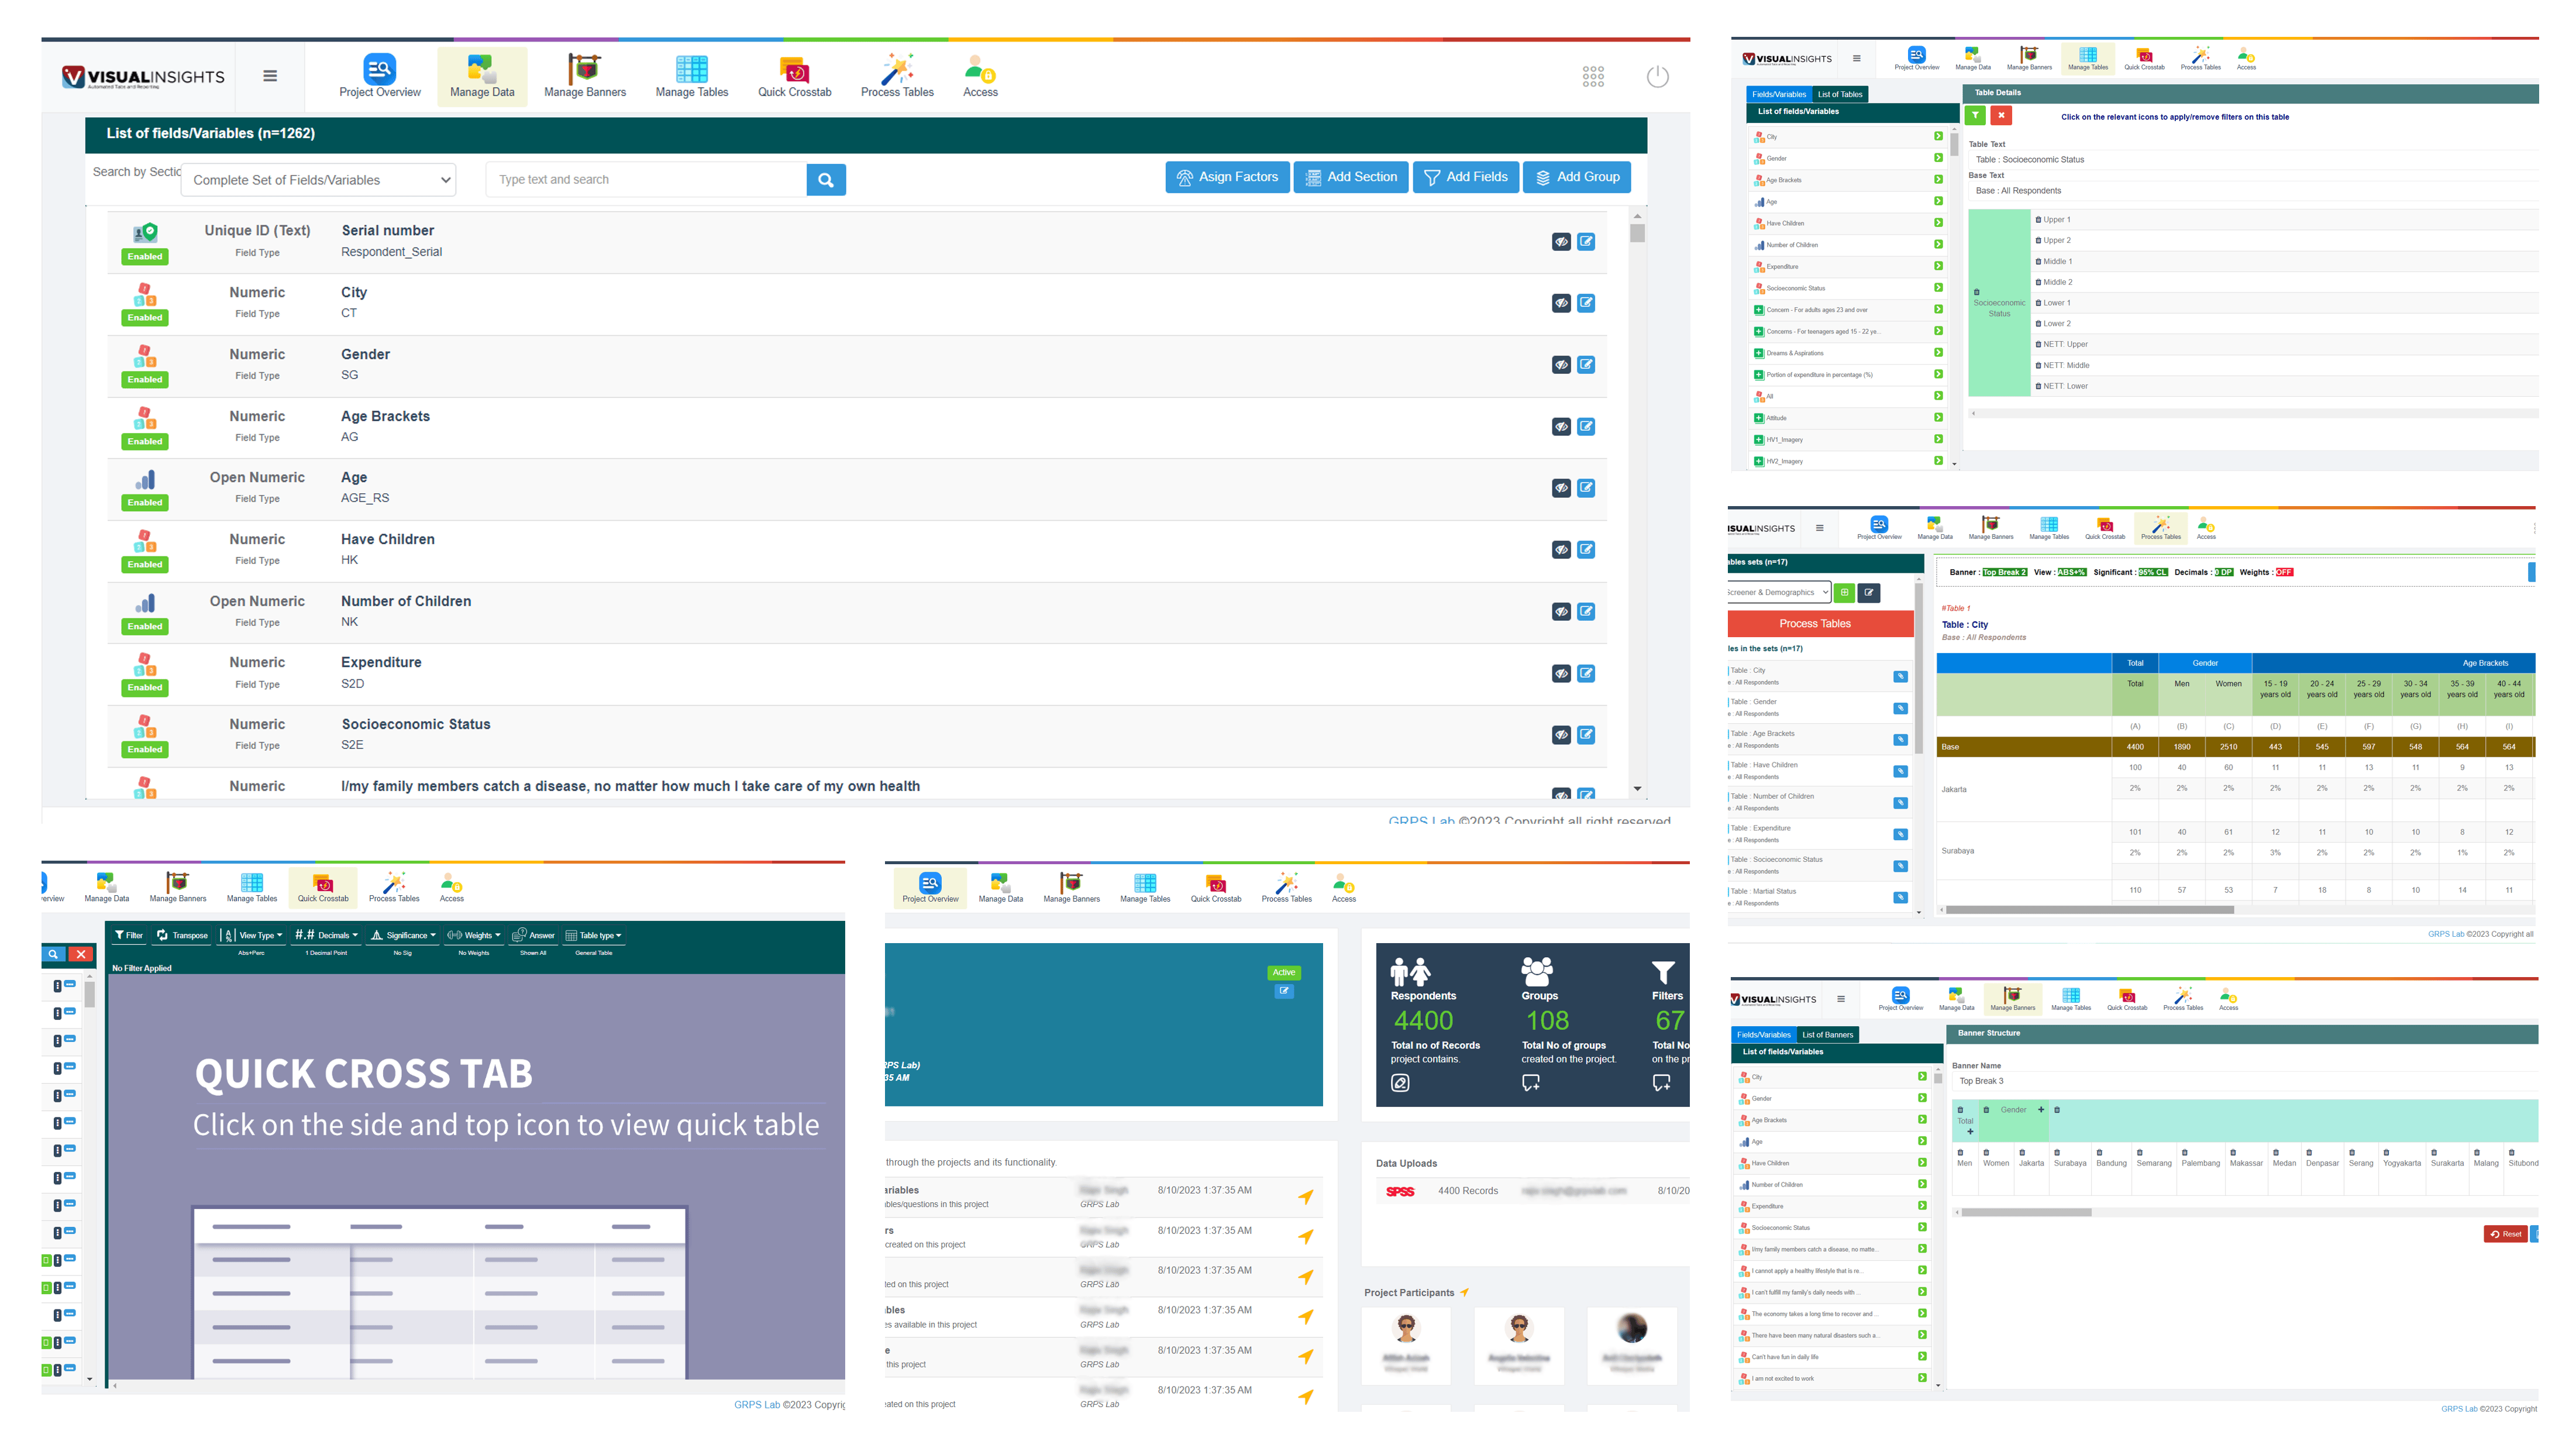
Solution: Efficient Data Analysis

Visual-Insights addresses these challenges with a fully automated platform that simplifies data analysis. Users can effortlessly generate dashboards and PowerPoint reports or download data tables for their research needs.

USP

Visual-Insights stands out for its ability to customize data weighting and analysis, catering specifically to the market research industry. It offers a time and cost-saving solution without compromising on quality and detail.

Fully Automated & Interactive Insights Platform

Visual-Insights is a no-code platform that offers seamless access to automated reports and dashboards. Its features include:

  • Reduced human intervention leading to fewer errors.
  • Precise and reliable data outputs with customizations.
  • Significantly shorter research timelines and lower costs.
  • Instant access to data tables, PowerPoint reports, and dashboards.

User Flow: Analysis & Insights in 4 Simple Steps:

Upload Your Data

Start by uploading your data set.

Customize Settings

Choose specifications from pre-designed templates or create custom settings.

Define Data Weights & Top Breaks

Adjust variables for data weighting and top breaks, and combine survey responses as needed.

Download Outputs

Access and download Excel data tables or PowerPoint reports in customized templates.

Versatility of Visual-Insights

Visual-Insights is adaptable to various requirements, offering both standard and ad-hoc solutions.

Standard Solutions

When you have standard survey products with standard questions

  • Create a new project and fill in relevant details.
  • Modify data labels, manage data, and create nettings.
  • Update analytical attributes as required.
  • Set up significance testing parameters.
  • Upload data in various formats.
  • Drag and drop variables for analysis.
  • Design top breaks for in-depth analysis.
  • Generate tables and export to Excel for further use.

Adhoc Solutions

When you are running adhoc projects and wants to save time and cost with quick access to data

  • Select a standard solution template.
  • Upload data files and specifications.
  • Modify survey weights and customize top breaks.
  • Input project-specific details.
  • Adjust data mapping and combine survey responses as needed.
  • Apply statistical significance testing before downloading data tables.

Transform your Data Analysis and Reporting

Are you ready to elevate your data analysis and reporting processes? Visual-Insights offers a revolutionary approach, catering to both standard and ad-hoc research needs with unparalleled efficiency and accuracy.

Whether you have recurring standard projects or unique, ad-hoc requirements, Visual-Insights is equipped to handle it all. Our platform’s adaptability ensures that your specific data analysis needs are met with precision and ease.

Connect with Our Experts

Don't miss the opportunity to transform the way you handle data. Reach out to our team of experts today to explore how Visual-Insights can revolutionize your data analysis and reporting. We are here to guide you through every step of the process and ensure that Visual-Insights aligns perfectly with your business needs.